The Revenue Pipeline Diagnostic™ produces two headline numbers:
Overall Revenue System Score (efficiency) – what percentage of potential revenue you are currently capturing.
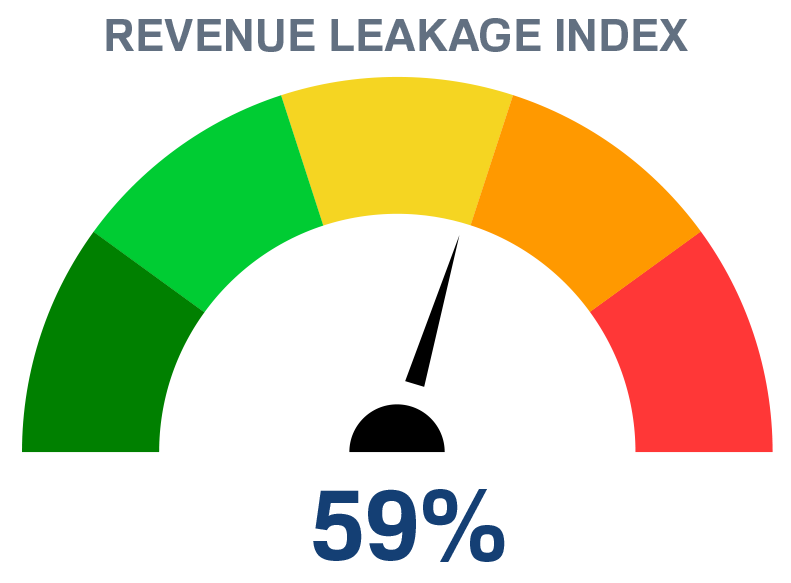
Revenue Leakage Index™ – what percentage of potential revenue you are losing to preventable inefficiencies.
They are two sides of the same coin. If your system is 41% efficient, your Revenue Leakage Index™ is 59%.
While both numbers are useful, the Leakage Index is the more direct metric for prioritizing remediation. It quantifies the opportunity – and urgency – of improvement.
| Index Range | Meaning |
| 0‑20% | Very low leakage – optimal system |
| 21‑40% | Low to moderate leakage – minor inefficiencies |
| 41‑60% | Moderate to high leakage – noticeable waste |
| 61‑80% | High leakage – significant inefficiencies |
| 81‑100% | Severe leakage – critical intervention needed |
The Revenue Leakage Index™ is derived from:
Not every stage carries equal weight. The Index weights stages based on:
The result is a single percentage that represents estimated revenue loss – not a weighted average of stage scores, but a composite metric designed to drive action.
| Tool | Purpose | When to Use |
| Revenue System Self-Assessment™ | Score your own 7 stages | Free entry point |
| Revenue Leakage Estimator™ | Directional financial estimate | Free, 2 minutes |
| Revenue System Scorecard™ | Stage‑by‑stage performance | Part of Diagnostic |
| Revenue Leakage Map™ | Visualize where leaks occur | Part of Diagnostic |
| Revenue Leakage Index™ | Leakage percentage (this page) | Part of Diagnostic |
| Overall Revenue System Score | Efficiency percentage (inverse) | Part of Diagnostic |
| Revenue Pipeline Diagnostic™ | Full analysis + roadmap | Paid engagement |
The Diagnostic produces two headline numbers. This page focuses on the Index because it is the more action‑oriented metric for driving remediation. The Overall Score is its inverse.
Without a headline metric, leadership teams debate opinions. The Revenue Leakage Index™ – combined with its inverse, the Overall Revenue System Score – replaces guesswork with a single, trusted pair of numbers.
Together, they help answer:
Is our revenue system improving or deteriorating?
Are our operational changes working? (Efficiency up = leakage down)
How does our system health compare to benchmarks?
The Index is calculated as part of the Revenue Pipeline Diagnostic™. For clients who engage Revenue System Intelligence™ (ongoing advisory), the Index is recalculated monthly or quarterly to track progress over time.
Revenue Systems Consulting Group helps businesses improve the systems that drive revenue growth.